ブログの投稿ログ
2021年
9月
-
19 日
Vue Domを直接取得し操作したい場合 -
18 日
二つの異なるボタンで対象の動的クラスを操作する -
17 日
ページ上部へ移動するボタン -
16 日
transitionタグの使い方 -
15 日
imgタグを動的に扱う -
14 日
使われていないセレクタを見つける -
13 日
ラジオボタンをVueで使う -
11 日
Vue ブラウザをリロード -
11 日
みんな大好きボタンコンポーネントについて -
10 日
メール 電話番号のバリデーション -
9 日
Vueでテキストコピーボタンを作る -
8 日
Vueでコインの値段を取得 -
7 日
Vueのslotタグについて -
7 日
mutationsやactionsに第三引数を渡したい -
5 日
Vueで便利なボタンコンポーネントを作成 -
4 日
myjsonでモックAPIを作成する -
3 日
”Vue” SVGアイコンの管理 -
2 日
NetlifyでFailedした話 -
1 日
Vueで404ページ
8月
-
31 日
filterの使い方 -
30 日
天気API取得してみた -
29 日
mapの使い方 -
28 日
jest入門してみた -
27 日
v-forの使い方 -
26 日
Blenderでドーナツ作ってみた その1 -
25 日
AngularでModal実装する -
24 日
入力したテキストの空白をとる -
23 日
ブルブルするアニメーション -
22 日
Railsでバックエンド -
21 日
Ruby on Rails 6 -
20 日
Angularで特殊文字を判定する -
20 日
任意の数列の間をとる -
18 日
数字のカウントアップアニメーションを実装 -
17 日
Githubのパスワード認証が廃止された話 -
16 日
SSH 接続をテストする -
15 日
PC→スマホでサイトをチェックしたい時 -
14 日
VueでD3触ってみた -
13 日
JavaでHello world -
12 日
任意のページのみで要素を表示 -
11 日
折れ線グラフを作成 -
9 日
家の温度/湿度を監視できる時計1 -
9 日
家の温度/湿度を監視できる時計2 -
8 日
type="range"を使用してみた -
7 日
みんなが知らない使えるHTMLタグ -
6 日
決められた数だけcheckedしたら送信 -
5 日
htmlでlazyLoadを実装する -
4 日
checkboxへCSSを当てる -
3 日
3点リーダーを実装 -
2 日
リーモートでも距離感のある交流を -
1 日
APIをテストしたい時
7月
-
30 日
エンジニアがワクチン予約に本気になると -
29 日
スクショで共有が面倒な方へ -
29 日
ペアプロにおすすめLive Share -
28 日
Vueコンポーネント間の値をやりとり その3 -
27 日
IOTおじさんへの道 その1 -
26 日
Vueコンポーネント間の値をやりとり その2 -
25 日
Vue コンポーネント間の値をやりとり その1 -
24 日
完璧なマークアップを実現する -
23 日
FizzBuzzを解説するよ -
22 日
サイト内でどんな技術が使われているか知りたい時 -
21 日
Gulpのconfigファイル -
20 日
初めてのラズパイ -
19 日
初心者でもコンパイルがしたい方へ -
18 日
Push.jsでプッシュ通知 -
17 日
リライトとリダイレクトって同じ? -
16 日
Netlifyで下層ページが見れなかった話 -
15 日
Vueで長文の文字列を省略してみ... -
14 日
Vuexでダークモード実装 -
13 日
Svelte触ってみた。 -
12 日
display:grid;が便利 -
11 日
Vuexを使ったモーダル実装 -
10 日
Angularの*ngForループでイベント発火 -
9 日
Angularでホバーイベント -
8 日
Vueでアコーディオンを爆速作成する -
7 日
VueXでTodoアプリ 完 -
6 日
VueXでTodoアプリ 01 -
5 日
初めてのREACT-v15 -
4 日
初めてのREACT-v14 -
3 日
全自動ポイ活おじさんになった話 -
2 日
会社のレクリエーションで競プロした話 -
1 日
初めてのREACT-v13
6月
-
30 日
Vueで作られたプレゼンツール -
29 日
JSで乱数を取得するあれを解説 -
28 日
初めてのREACT-v12 -
27 日
初めてのREACT-v11 -
26 日
初めてのREACT-v10 -
25 日
Angularでjson server使ってみた。 -
24 日
AngularでAPIから配列を取得した想定で出力してみた。 -
23 日
初めてのREACT-v9 -
22 日
分割代入って何? -
21 日
JSでよく見る...fugaって? -
20 日
Dockerってなんぞ?(フロントエンド2年生が解説してみた。 -
19 日
Docker内のMongoDBにデータをインポート -
18 日
初めてのREACT-v8 -
17 日
LP作成でよく使う簡単なアニメーション -
16 日
スケール練習アプリ作った話 -
15 日
Pluginで自動生成されたタグに属性を付与する。 -
14 日
初めてのREACT-v7 -
13 日
初めてのREACT-v6 -
12 日
初めてのREACT-v5 -
11 日
初めてのREACT-v4 -
10 日
初めてのREACT-v3 -
9 日
初めてのREACT-v2 -
8 日
初めてのREACT
VueでD3触ってみた

<template>
  <div class="hello">
    <div id="vue">
			// svg要素を追加
      <svg
        id="circle"
        :width="width"
        :height="height"
        style="border: 1px dotted"
      ></svg>
			// rangeと同期した数値を表示
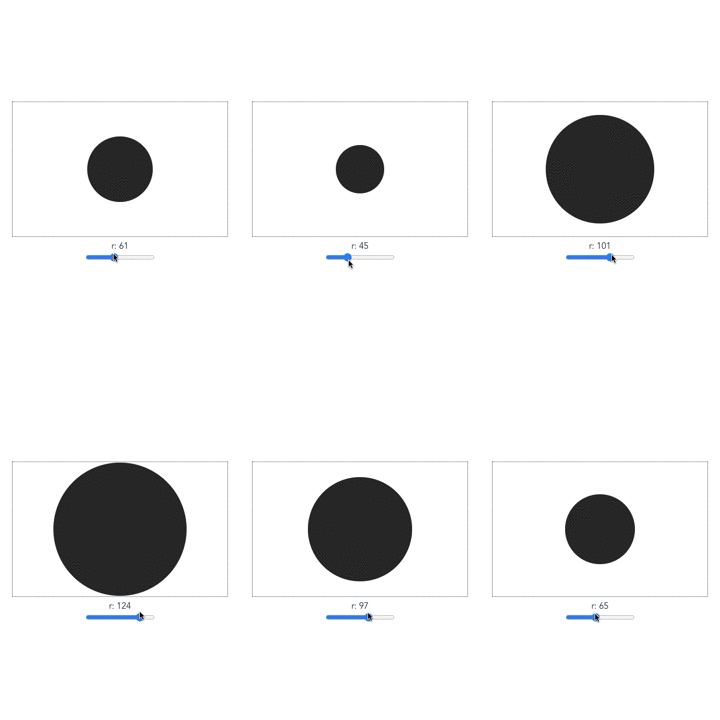
      <div>r: {{ r }}</div>
      <div><input type="range" v-model="r" min="1" max="150" step="1" /></div>
    </div>
  </div>
</template>

<script>
// D3をインポート
import * as d3 from "d3";
export default {
  name: "HelloWorld",
  data() {
    return {
			// 横幅指定
      width: 400,
			// 縦幅指定
      height: 250,
			// rangeの初期値
      r: 75,
    };
  },
  mounted: function () {
		// d3.selectで編集したい要素を指定
    var svg = d3.select("#circle");
    this.circle = svg
      .append("circle") // 要素追加
      .attr("cx", this.width / 2) // width属性追加
      .attr("cy", this.height / 2) // height属性追加
      .attr("r", this.r) // range属性を追加
      .style("fill", "rgba(0, 0, 0, 0.8)"); // fill属性で要素に色をつける
  },
	// 監視対象の定義
  watch: {
    r: function (newValue) {
			// range属性を監視
      this.circle.attr("r", newValue);
    },
  },
};
</script>

.......
.......
.......
# まとめ
以前作った温度湿度モニターへグラフ機能を追加するべくD3を調べてみました!
次回はグラフに関する記事がかければと思います!
